
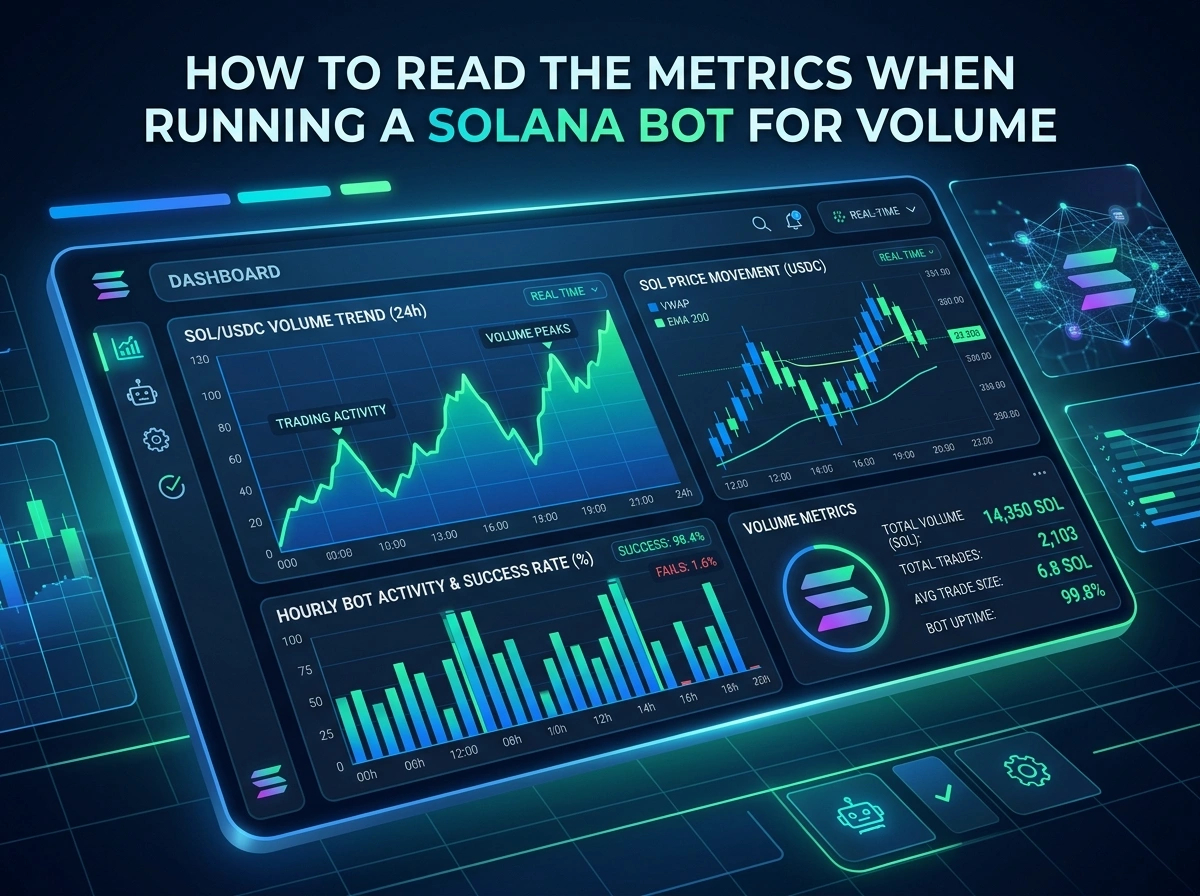
Running a volume bot on Solana is one thing. Understanding what the numbers actually tell you is another. Many project teams launch automated trading activity, watch the dashboard light up, and assume everything is working as planned. But raw activity means very little without context. The real value comes from reading the metrics correctly and turning them into decisions that support your goals.
Whether you manage a token launch, run a marketing campaign, or operate trading infrastructure, the data your bot produces is a window into how healthy and believable your on-chain activity looks. This guide breaks down the most important metrics, what they mean, and how to interpret them with a critical eye.
Why Metrics Matter More Than Raw Volume
It is easy to get fixated on a single number, like total trading volume, and treat it as proof of success. In reality, that figure is only the surface. Exchanges, aggregators, and savvy community members look deeper. They check whether activity appears organic, whether trades come from a range of wallets, and whether the pattern holds up under scrutiny.
Reading metrics well helps you spot problems early, refine your strategy, and avoid patterns that look artificial. It also protects your budget, since every transaction on Solana carries a cost. Let’s walk through the indicators that matter most.
Core Performance Metrics to Track
Transaction Count
Transaction count is the foundation. It tells you how many trades your bot has executed over a given period. On its own, a high count looks impressive, but you need to compare it against your target and the natural rhythm of the market.
Ask yourself whether the count matches the level of activity a real, growing token would show. A sudden spike of thousands of transactions in a few minutes, followed by total silence, rarely looks credible. Steady, sustained counts tend to read as more authentic.
Successful Versus Failed Transactions
Solana is fast, but failed transactions still happen. They occur when network congestion, slippage limits, or insufficient priority fees block a trade from settling. Tracking your success rate is essential.
A healthy operation usually maintains a high ratio of successful to failed transactions. If your failure rate climbs, it signals one of several issues: your slippage settings may be too tight, your priority fees too low, or the network may be congested. A high failure rate also wastes money, since some failed attempts still consume fees. Watch this ratio closely and adjust your configuration when failures rise.
Wallet Distribution
Wallet distribution may be the single most important metric for believability. It measures how many unique wallets are involved in the activity and how trades are spread across them.
If all your volume flows through a handful of addresses, the pattern becomes obvious to anyone reviewing the chain. A broad, well-distributed set of wallets looks far more natural. When reviewing this metric, check the number of active wallets, the balance of buys and sells across them, and whether any single wallet dominates the flow. Good distribution is what separates convincing activity from an easily spotted setup.
Reading Market Behavior Metrics
Trading Velocity
Trading velocity describes the pace and rhythm of your transactions over time. Real markets breathe. They have busy periods, quiet stretches, and gradual shifts in momentum.
A bot that fires trades at perfectly even intervals creates a mechanical signature. By contrast, varying the timing and size of trades produces a more lifelike velocity. Review your velocity charts and look for natural ebbs and flows rather than a flat, robotic line.
Slippage
Slippage is the difference between the price you expect and the price you actually get. On low-liquidity pools, even modest trades can move the price and create large slippage.
Monitoring slippage tells you two things. First, it shows whether your trades are executing efficiently. Second, it reveals how thin or deep the pool really is. High slippage eats into your budget and can distort the price action you are trying to support. If you notice slippage climbing, consider smaller trade sizes or adding liquidity.
Liquidity Depth
Liquidity depth measures how much capital sits in the pool to absorb trades. The deeper the pool, the less each trade moves the price.
This metric directly affects everything else. Shallow liquidity leads to high slippage, erratic price swings, and a higher chance of failed transactions. Before scaling up activity, check that the pool has enough depth to handle your intended volume smoothly. Choosing the right platform and the right pool matters here, and a well-configured bot for volume can help you align your activity with the liquidity available.
Cost and Efficiency Metrics
Fee Spend
Every transaction on Solana costs SOL, including base fees and any priority fees you add to improve execution. Fee spend tracks the total cost of your operation.
Reading this metric helps you measure efficiency. Divide your fee spend by the volume generated to find your cost per unit of activity. If that ratio rises, you may be paying too much in priority fees or running too many low-value transactions. Keeping fee spend in check ensures your campaign stays sustainable over time.
Time Intervals
The spacing between transactions deserves its own attention. Time intervals influence how natural your activity appears and how evenly your budget is used.
Tight, uniform intervals create a predictable pattern. Randomized, varied intervals mimic human behavior far better. Review the distribution of your intervals and aim for irregularity that still fits your overall schedule.
Sustainability and Authenticity Metrics
Retention of Activity
Retention measures whether activity continues over time or collapses the moment the bot stops. A token that shows volume only during bot operation, then goes silent, tells a clear story.
The goal is to use automated activity as a foundation that encourages genuine participation. Watch whether organic trades begin to appear alongside your bot activity. Growing organic retention is a strong sign that your broader strategy is working.
Suspicious or Artificial-Looking Patterns
Finally, train yourself to spot the red flags that others will notice too. These include repetitive trade sizes, identical timing gaps, circular flows between the same wallets, and volume that appears and vanishes without any price discovery.
Review your data the way a skeptical analyst would. If a pattern looks obviously automated to you, it will look that way to exchanges and community members. The best operations blend variety into every metric, from trade size to timing to wallet behavior.
Bringing the Metrics Together
No single metric tells the whole story. The skill lies in reading them as a connected system. A high transaction count means little if wallet distribution is poor. Strong volume loses value if slippage is eating your budget and failures are climbing.
Build a habit of reviewing your metrics together, on a regular schedule. Compare them against your goals, watch for warning signs, and adjust your configuration as conditions change. Over time, you will develop an instinct for what healthy, believable activity looks like.
Conclusion
Reading the metrics behind a Solana volume bot is what turns raw automation into a thoughtful strategy. Transaction count, success rates, wallet distribution, trading velocity, slippage, liquidity depth, fee spend, time intervals, retention, and pattern analysis each reveal a different piece of the picture. Together, they help you operate with precision and credibility.
Treat your dashboard as a source of insight rather than a scoreboard. The teams that succeed are the ones who study their data, question what they see, and refine their approach until the activity looks as natural as it is effective.
